The dangers that have been overlooked.
The ARkStorm studies look at California as a whole. This section is our founder’s own analysis of specific places they miss. He has identified more than 100, and they will be added here one by one.
Los Angeles and Long Beach harbor
Southern California’s floodwater ends up in San Pedro Bay, at the foot of the ports of Los Angeles and Long Beach.
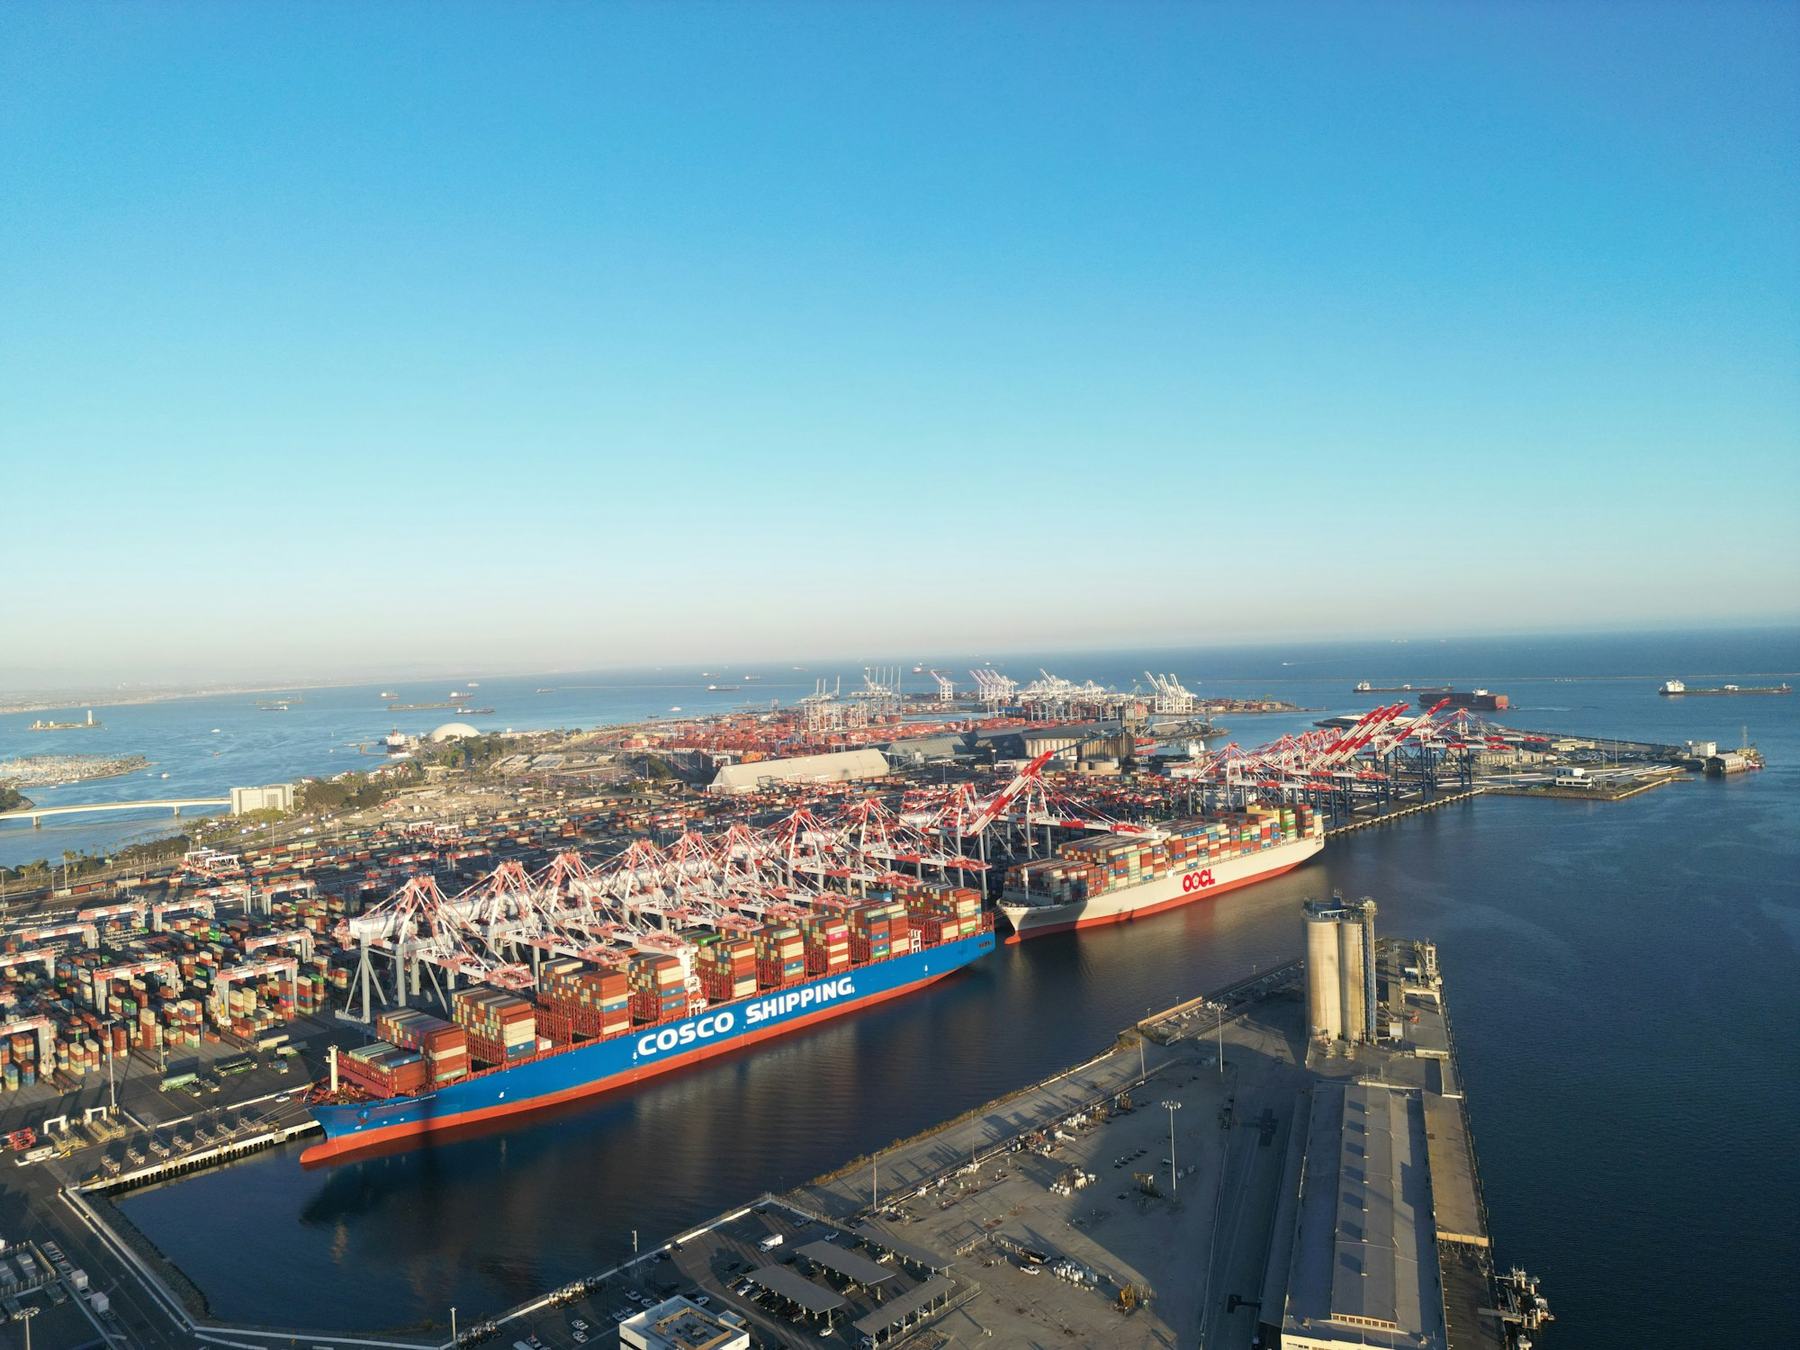
Montrose Chemical Corporation was once the world’s largest maker of DDT. Its waste, along with PCBs, heavy metals and more, was dumped into the bay at the foot of the Los Angeles and Long Beach terminals.
The 2011 USGS scenario shows serious flooding in Los Angeles County and Orange County. The Los Angeles and San Gabriel rivers both empty into San Pedro Bay.
What a megaflood would do to the harbor.
These are ARkStorm.org’s own estimates. [JIM: one line on how you worked these out]
-
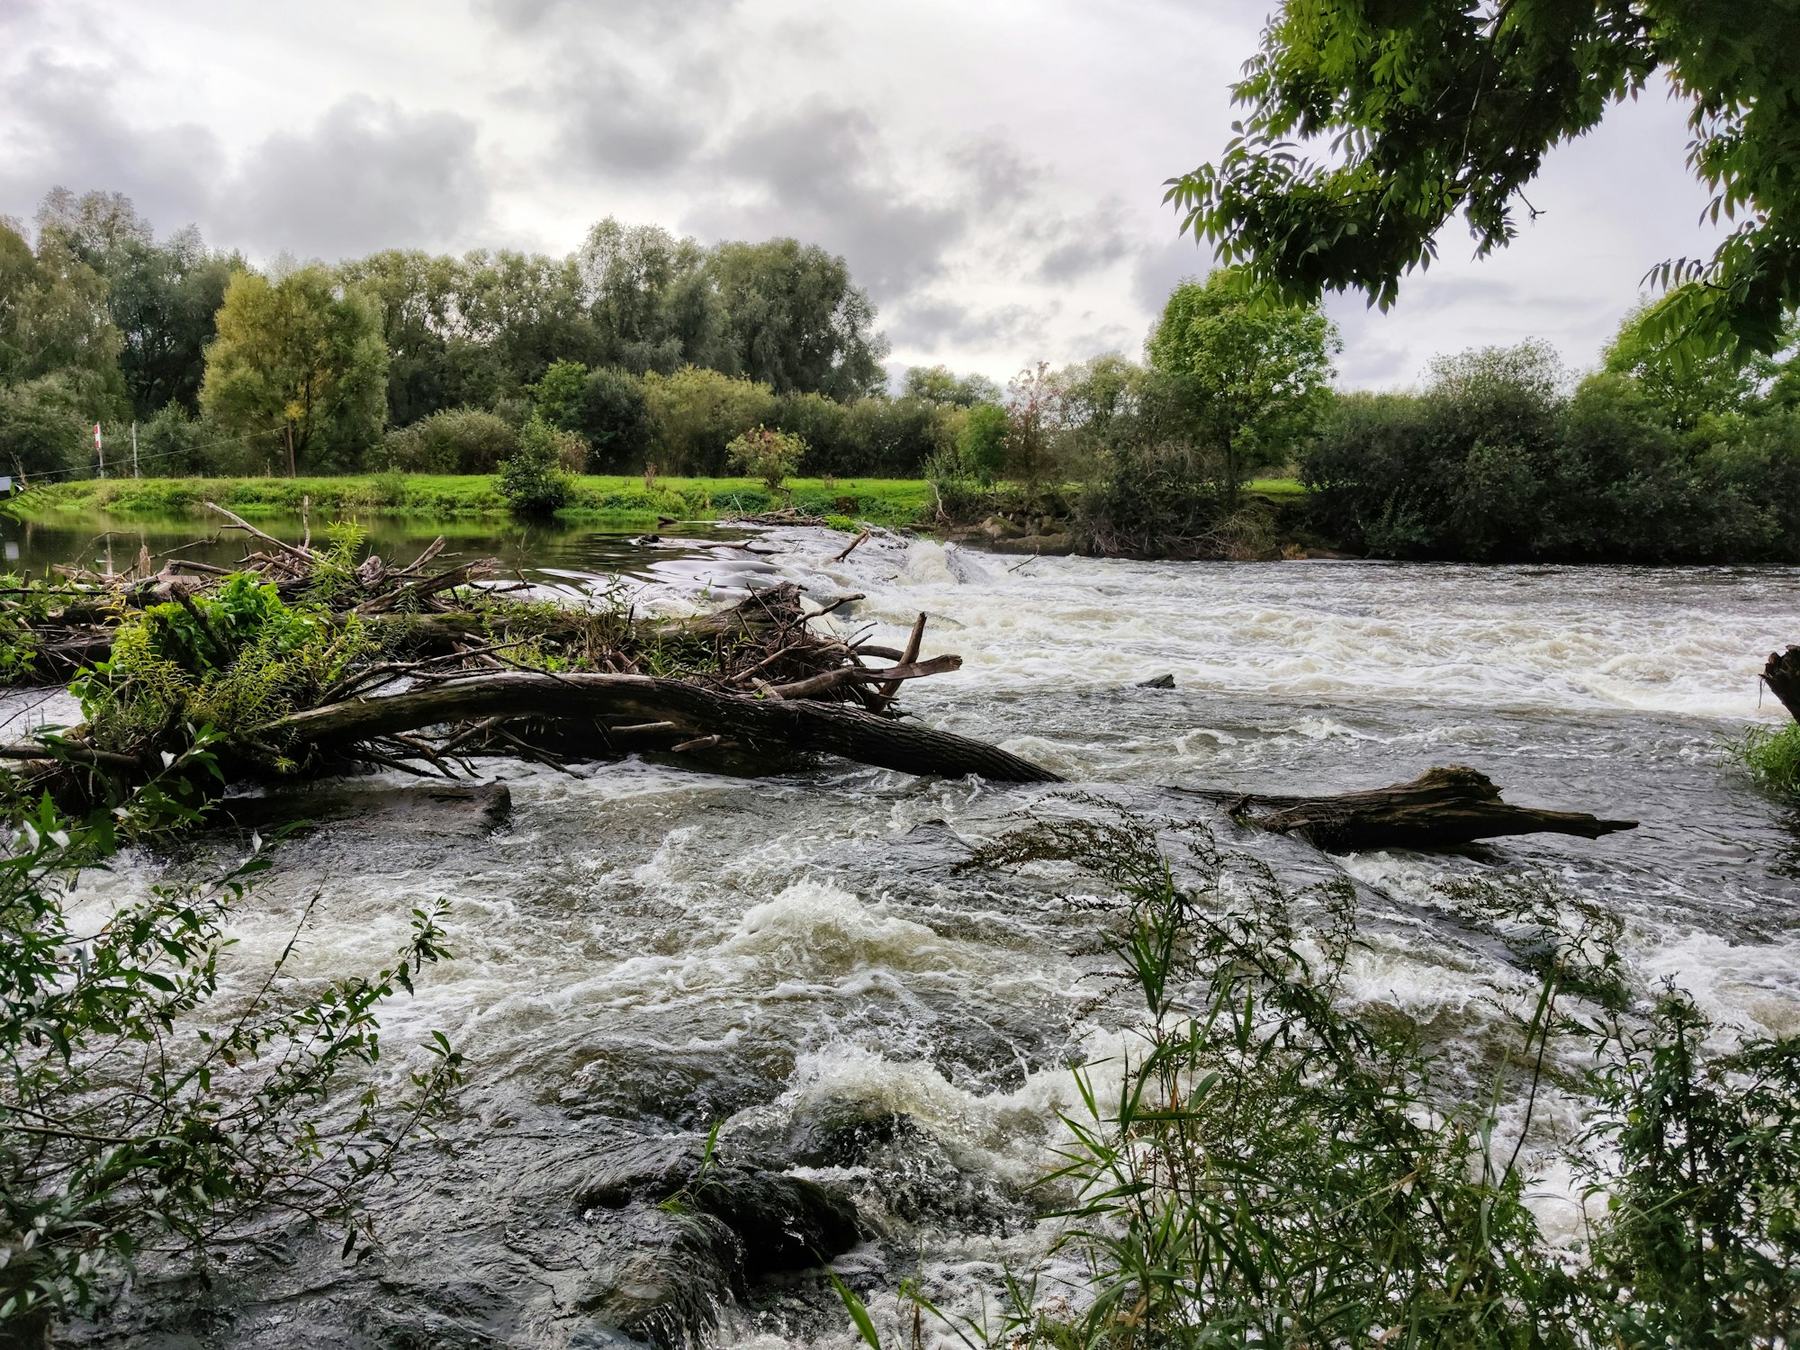
Debris reaching the bay
22 to 50 million tonsToxic flood debris from chemical plants, oil companies, destroyed homes and commercial buildings, thousands of cars leaking oil and gas, raw sewage, thousands of animals, trees, concrete and asphalt.
-
What happens when it hits the water
Winds over 100 mphOnshore winds turn the bay into a washing machine. They churn the runoff together with the DDT, PCBs and heavy metals already on the bottom.
-
Time to clear it
Yearsto clear the toxic debris that flows into the bay.
-
Cost to repair the harbor
More than $2 trillionjust to repair the destruction at the Los Angeles and Long Beach harbor terminals. The 2022 update puts damage across all of California at over $1 trillion.
Tijuana River Valley
We have not found the Tijuana River Valley mentioned in any ARkStorm study.
Lay the valley over the flood map from 1862 and it is completely under water. We expect a complete wipeout there, with thousands of deaths.
The river’s old path, laid over today’s streets
The colors show the Tijuana River as it was about 1850: the wide corridor it moved across, its channel, its marshes and its wet meadows. The gray map underneath is today. This is not the 1862 flood line. It comes from a San Francisco Estuary Institute study of old surveys and maps.
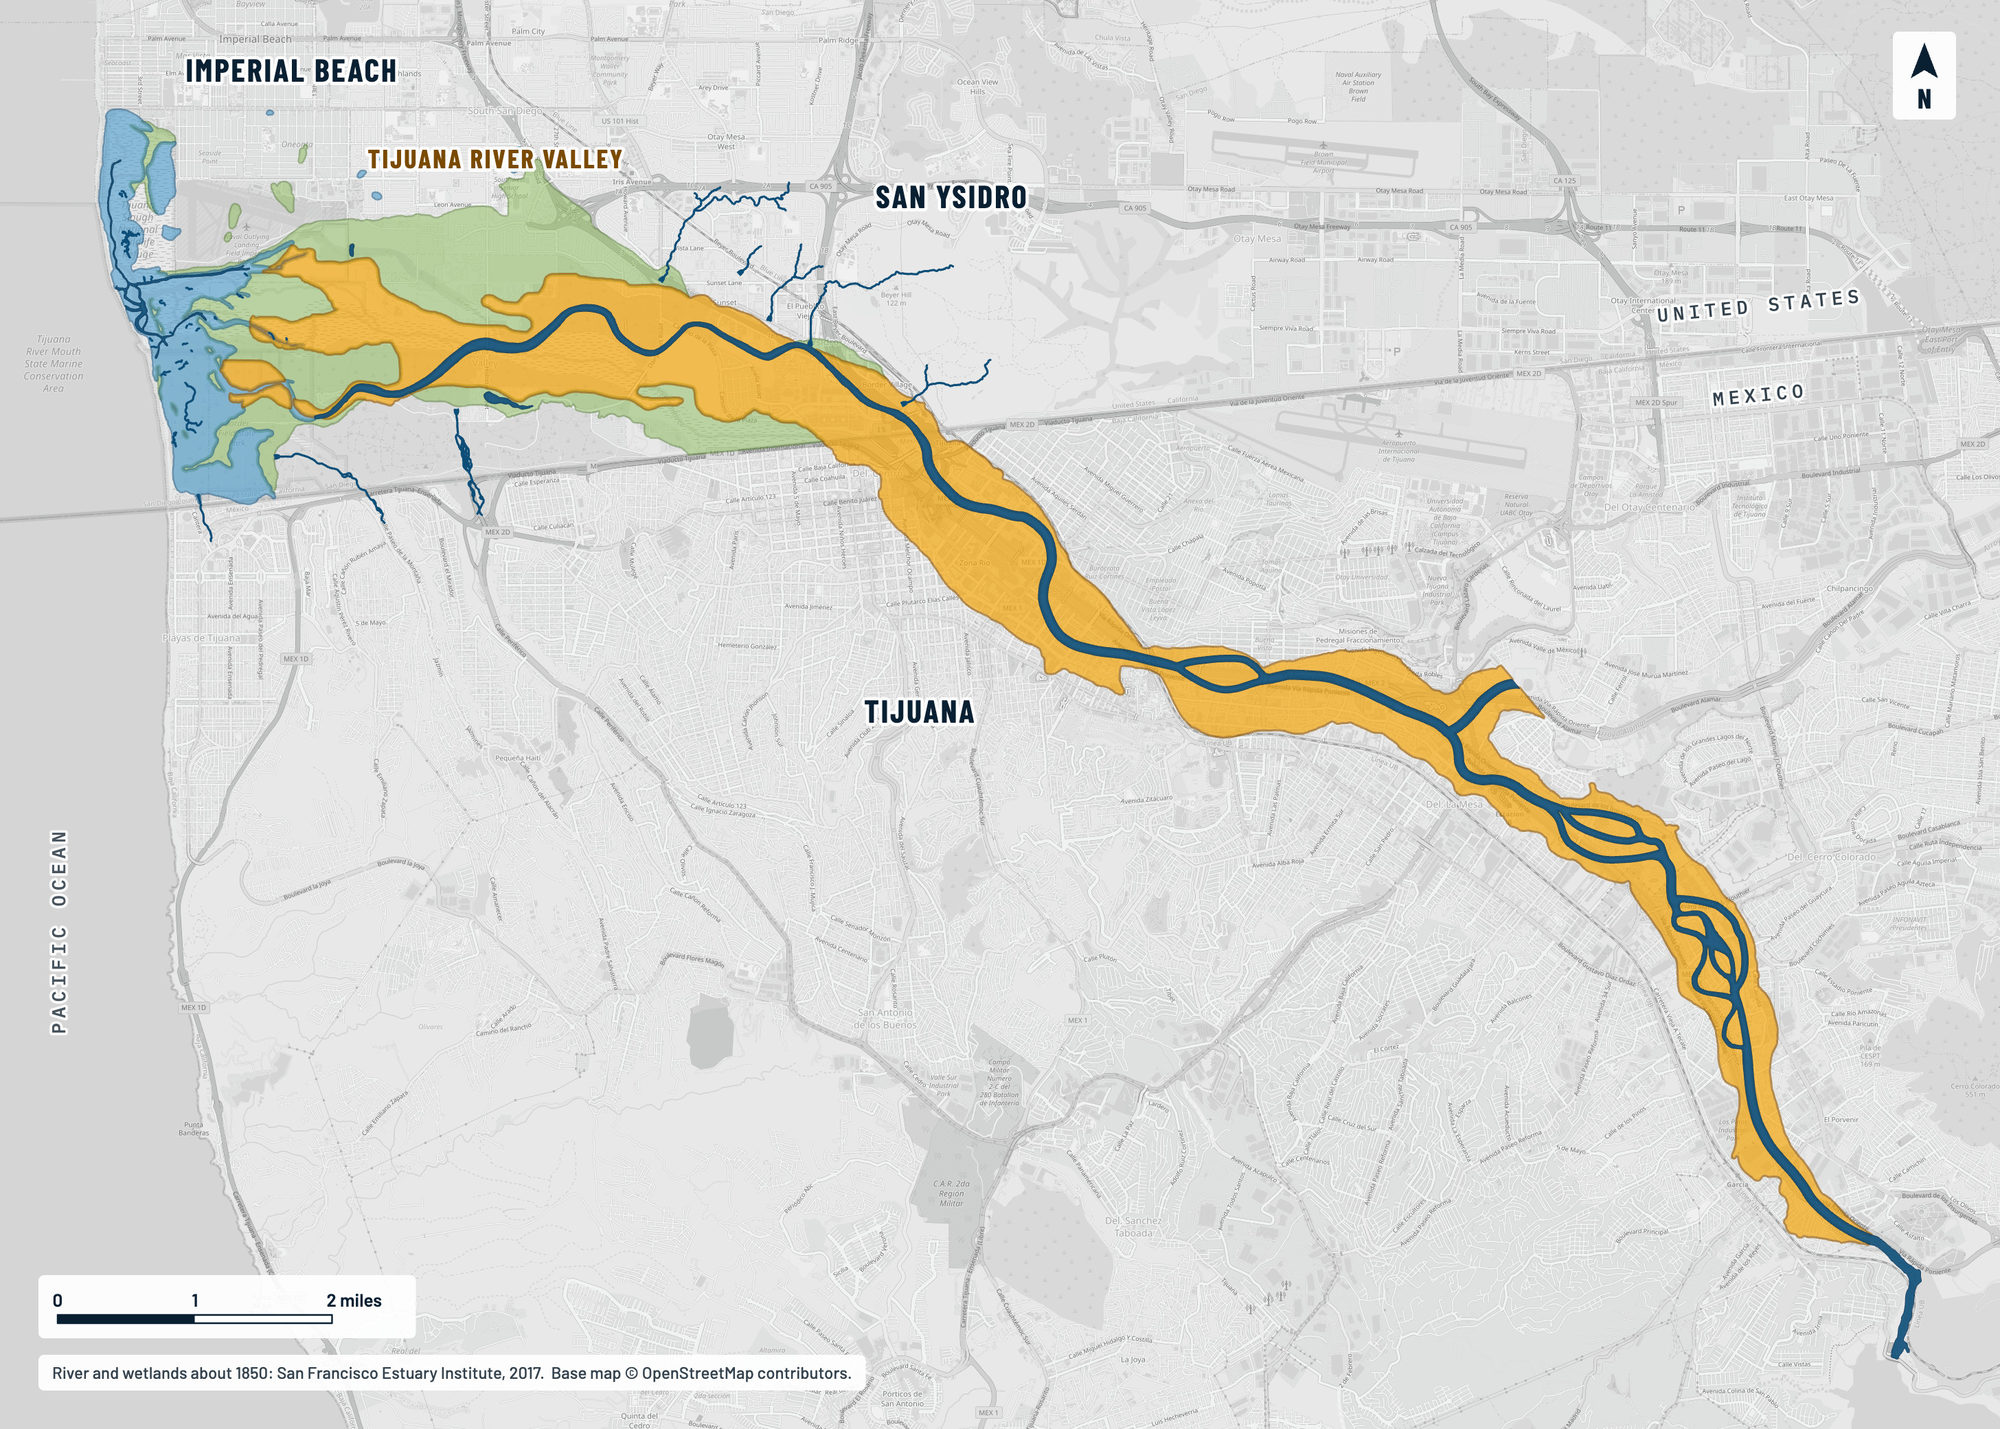
- River corridor
- River channel and streams
- Marsh and tidal flats
- Wet meadow
Homes built in old river beds
FEMA’s flood maps only go back to the late 1960s and early 1970s. They are the basis for flood insurance and building codes.
Developers who covered a small stream and ran drain pipes to reroute it may not have known they were building in an ancient river bed. When an ARkStorm hits, that river will find its old path again.
One subdivision two miles from our founder’s home sits in an old river bed carved by a past ARkStorm. The river will run right through that neighborhood.
More than 100 sites like these.
We’re adding them one at a time. Get an email when a new one is published.
Sources
- Porter, K., and others (2011). Overview of the ARkStorm Scenario. U.S. Geological Survey Open-File Report 2010-1312.
- Port of Los Angeles. Facts and Figures, 2025 (jobs figure).
- [JIM: sources for the 40% figure, the DDT figures, the 1862 flood map and the FEMA map dates]